SBA loan data
SBA loan size benchmarks by industry: FY2020–FY2025
A national average can hide a wide range of loan sizes. Compare the middle approval, the spread and selected industries, with separate measures for 7(a) and the CDC component of 504 financing.
Data as of (SBA 7(a) & 504 FOIA release). Headline figures cover fiscal years 2020 through 2025 (October 1, 2019 to September 30, 2025). Methodology and sources.
Three findings from the recorded approvals
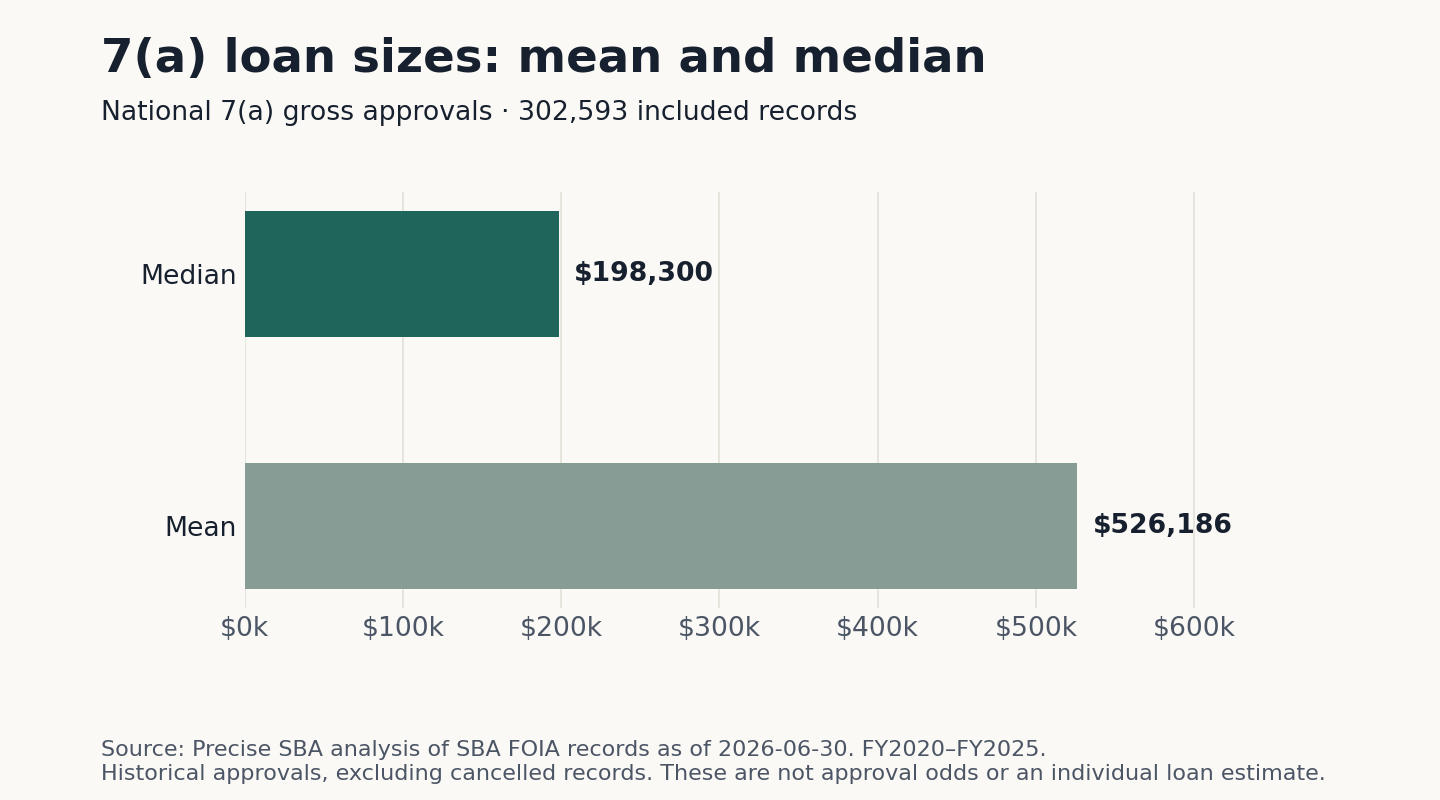
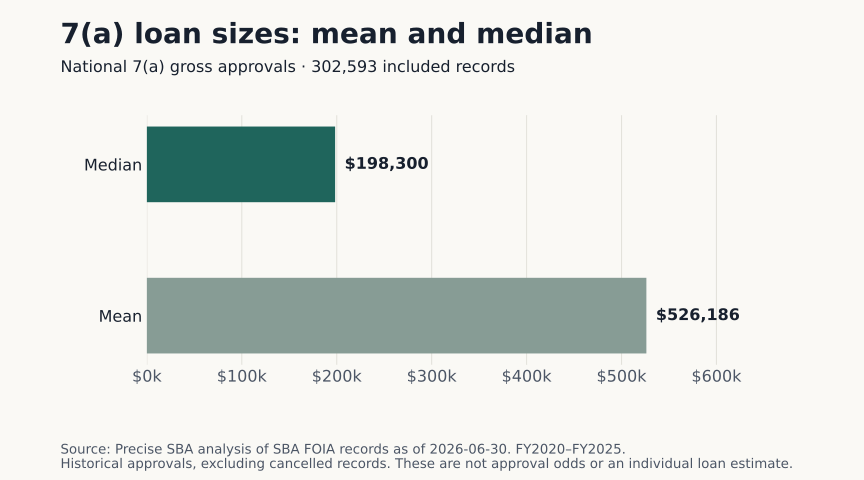
- The national mean is higher than the median. Across 302,593 included 7(a) approvals, the mean gross approval was $526,186 and the median was $198,300. The middle half ran from $52,000 to $518,000.
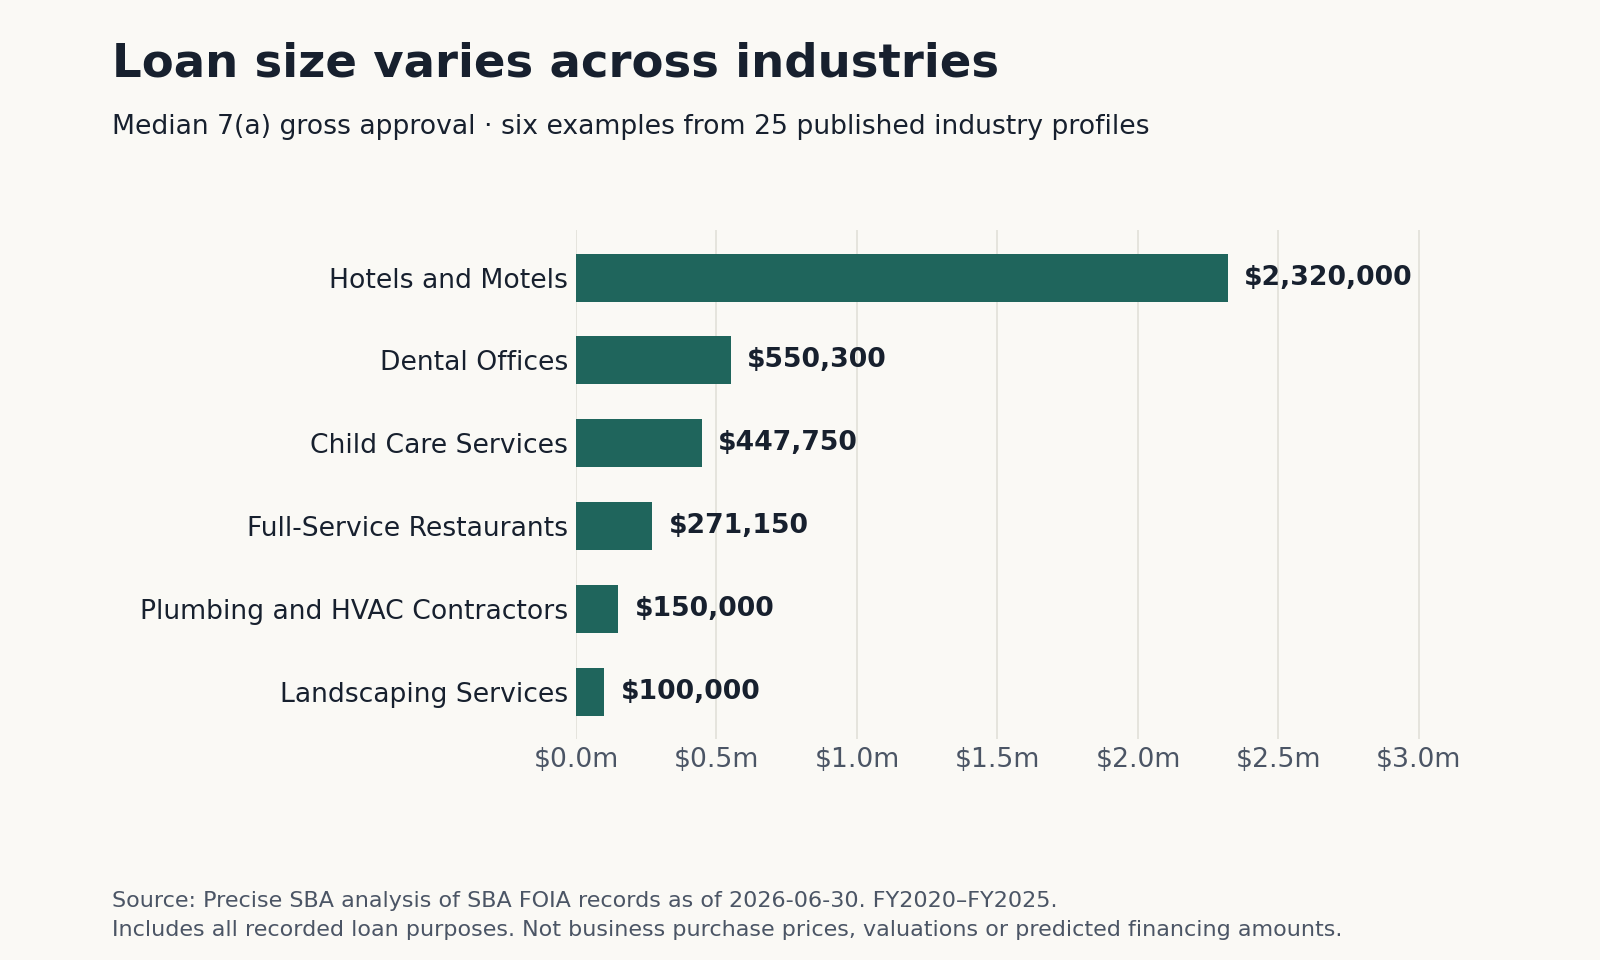
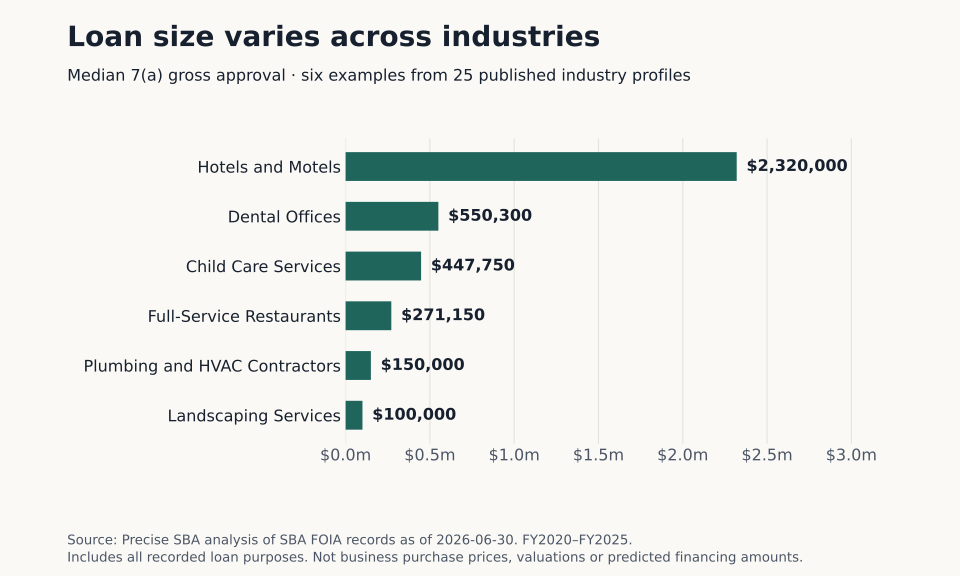
- Industry context matters. The 7(a) median was $150,000 for plumbing/HVAC contractors, $550,300 for dental offices and $2,320,000 for hotels/motels. These examples come from the selected profiles below; they do not rank every SBA industry.
- 504 is a different amount measure. Its national median of $631,000 describes the CDC gross approval component. It does not include the first-lien bank portion or measure the whole project.
Download the free aggregate CSV 52 rows · no email or sign-up · no borrower records
These are historical approvals for all recorded purposes. They are not business valuations, acquisition prices, current balances, approval probabilities or a prediction for your application. The data contains approved loans, not the rejected requests needed to calculate an approval rate.
Working on a purchase? Use the free project-budget worksheet, or start a free financing file for guided help organizing your own deal. You can read and download all of this research without signing up.
Read the average alongside the middle loan
7(a) loan sizes across the 25 selected industries
The industries were selected by combined 7(a) and 504 approval count in the complete period, then sorted alphabetically here. Selection is by activity, not by median size, financing quality or acquisition suitability. Each row links to its full profile.
| Industry / NAICS | Loans | Median | Q1 | Q3 | Mean |
|---|---|---|---|---|---|
| Other Personal Services812990 | 2,329 | $132,200 | $48,200 | $350,000 | $328,064 |
| Other Professional and Technical Services541990 | 2,470 | $200,000 | $76,750 | $471,500 | $453,198 |
| All Other Specialty Trade Contractors238990 | 5,029 | $170,000 | $51,500 | $488,000 | $471,405 |
| Beauty Salons812112 | 4,221 | $80,000 | $29,800 | $245,000 | $202,163 |
| Child Care Services624410 | 4,242 | $447,750 | $140,000 | $980,000 | $835,097 |
| Electrical Contractors238210 | 3,511 | $150,000 | $50,000 | $350,000 | $400,449 |
| Fitness and Recreational Sports Centers713940 | 5,706 | $265,000 | $75,000 | $499,000 | $410,576 |
| Full-Service Restaurants722511 | 13,592 | $271,150 | $80,000 | $655,525 | $534,257 |
| General Automotive Repair811111 | 4,469 | $248,800 | $55,000 | $650,000 | $489,956 |
| Local General Freight Trucking484110 | 4,843 | $62,700 | $25,000 | $193,900 | $272,365 |
| Long-Distance Truckload Trucking484121 | 5,866 | $67,000 | $29,125 | $150,000 | $202,107 |
| Home Health Care Services621610 | 2,632 | $200,000 | $89,700 | $500,000 | $488,432 |
| Hotels and Motels721110 | 4,627 | $2,320,000 | $1,300,000 | $3,765,000 | $2,522,497 |
| Insurance Agencies and Brokerages524210 | 3,701 | $235,300 | $91,900 | $565,000 | $475,343 |
| Landscaping Services561730 | 5,167 | $100,000 | $40,000 | $300,000 | $301,702 |
| Limited-Service Restaurants722513 | 10,028 | $325,000 | $115,000 | $570,000 | $478,215 |
| Chiropractor Offices621310 | 2,577 | $150,000 | $58,500 | $334,000 | $268,989 |
| Dental Offices621210 | 3,469 | $550,300 | $170,100 | $1,275,000 | $944,036 |
| Law Offices541110 | 2,691 | $150,000 | $51,700 | $390,000 | $361,536 |
| Physician Offices621111 | 3,300 | $300,000 | $101,975 | $720,275 | $608,846 |
| Other Personal Care Services812199 | 3,073 | $165,000 | $50,000 | $480,500 | $355,728 |
| Pet Care Services812910 | 2,464 | $245,450 | $60,000 | $637,250 | $502,152 |
| Plumbing and HVAC Contractors238220 | 5,225 | $150,000 | $50,000 | $454,100 | $447,486 |
| Residential Remodelers236118 | 6,325 | $75,000 | $30,000 | $150,000 | $183,531 |
| Snack and Nonalcoholic Beverage Bars722515 | 4,285 | $260,000 | $75,000 | $487,000 | $378,827 |
504 CDC component sizes, separately
Compare these figures within the 504 program. A smaller CDC component does not necessarily mean a smaller total project. This table covers the same selected industries as the 7(a) table; it is not a separate ranking of the most active 504 industries.
| Industry / NAICS | Loans | Median | Q1 | Q3 |
|---|---|---|---|---|
| Other Personal Services812990 | 433 | $475,000 | $277,000 | $840,000 |
| Other Professional and Technical Services541990 | 359 | $557,000 | $310,000 | $1,030,000 |
| All Other Specialty Trade Contractors238990 | 650 | $547,500 | $302,500 | $886,000 |
| Beauty Salons812112 | 347 | $237,000 | $150,500 | $426,000 |
| Child Care Services624410 | 1,162 | $820,000 | $362,250 | $1,661,750 |
| Electrical Contractors238210 | 346 | $497,000 | $258,750 | $908,750 |
| Fitness and Recreational Sports Centers713940 | 533 | $812,000 | $385,000 | $1,440,000 |
| Full-Service Restaurants722511 | 1,988 | $650,000 | $372,000 | $1,122,000 |
| General Automotive Repair811111 | 893 | $423,000 | $260,000 | $692,000 |
| Local General Freight Trucking484110 | 199 | $867,000 | $419,000 | $1,628,000 |
| Long-Distance Truckload Trucking484121 | 195 | $1,030,000 | $514,500 | $1,901,500 |
| Home Health Care Services621610 | 158 | $522,000 | $289,500 | $1,060,250 |
| Hotels and Motels721110 | 1,587 | $2,056,000 | $1,074,000 | $3,392,000 |
| Insurance Agencies and Brokerages524210 | 463 | $275,000 | $179,000 | $479,000 |
| Landscaping Services561730 | 411 | $374,000 | $251,500 | $660,500 |
| Limited-Service Restaurants722513 | 974 | $676,000 | $372,250 | $1,118,000 |
| Chiropractor Offices621310 | 336 | $291,000 | $197,750 | $497,750 |
| Dental Offices621210 | 778 | $641,000 | $387,750 | $1,018,750 |
| Law Offices541110 | 892 | $455,500 | $262,000 | $846,500 |
| Physician Offices621111 | 866 | $705,500 | $401,500 | $1,310,750 |
| Other Personal Care Services812199 | 152 | $321,000 | $183,750 | $664,250 |
| Pet Care Services812910 | 286 | $457,500 | $246,000 | $818,000 |
| Plumbing and HVAC Contractors238220 | 599 | $493,000 | $301,500 | $870,500 |
| Residential Remodelers236118 | 184 | $465,500 | $258,750 | $831,250 |
| Snack and Nonalcoholic Beverage Bars722515 | 226 | $471,500 | $266,000 | $658,750 |
Methodology, scope and reuse
- Source and period. The SBA's public 7(a) and 504 FOIA files, as of 2026-06-30. Complete fiscal years 2020 through 2025; FY2026 in this release is partial and is excluded from the comparisons above.
- Population. Loan records with an approval fiscal year in the stated range, excluding records marked cancelled. Counts are loan approvals, not unique businesses. Later paid, defaulted or other outcomes do not remove a historical approval from this population.
- Amounts and quantiles. GrossApproval in USD, rounded to whole dollars by the existing pipeline. The mean is total divided by count. Median, Q1 and Q3 use linear interpolation at positions (n − 1) × 0.50, 0.25 and 0.75, rounded to whole dollars.
- Industry selection. The 25 six-digit NAICS codes with the most combined program approvals in this population. Industry is the code recorded on the loan. Historical classifications and industry mix can affect comparisons.
- Suppression. Figures for groups with fewer than 10 records are not published. A suppressed CSV value would be blank, not zero. The selected groups in this release meet the threshold.
- Verification. Published aggregate counts, sums, means and quantiles were reproduced from the official files and independently matched for the national and 25 selected industry populations in each program on October 22, 2026.
Full source fields, filters and geographic rules are in the data methodology. The CSV contains both national rows and all selected industry/program rows, with period, amount basis and data-as-of date. All national approvals are included in the national statistics; the industry selection does not limit those national figures.
Share the original charts or aggregates under CC BY 4.0, crediting Precise SBA's analysis of SBA FOIA data and retaining the period, source date and 504 component distinction. Link to this report for its methods and current version. The underlying U.S. government source data has its own public-domain notice.
Use the benchmark as context, then build your own numbers
A purchase needs a project budget, a source of funds and enough cash flow for its obligations. A historical industry median cannot answer those questions. Start with the free acquisition calculator, the sources-and-uses workbook, or the financing file below for guided help organizing an actual deal.
Related guides
Have a specific deal in mind?
The numbers above describe loans that were approved. They do not say what any lender would do with your request. Tell us what you are trying to finance and we will help you see how it lines up. No documents needed to start, and we do not pull your credit.
Figures are compiled by Precise SBA from the U.S. Small Business Administration's public 7(a) and 504 FOIA loan-level data and are shown as recorded, including lender names. They describe past approvals only: they are not rates, approval odds, a ranking or an endorsement of any lender, and not a prediction for any loan. Precise SBA is not a lender and is not affiliated with the U.S. Small Business Administration. We never charge you. If a loan closes, the lender may pay us a referral fee, disclosed on SBA Form 159 (how we get paid).